


Using synthetic monitoring to track your web application’s health and performance is an effective way to ensure it’s up and running at its optimal performance. However, synthetic monitoring is much more than monitoring your application’s availability and performance.
In this article, we’re going to look at five best practices for synthetic monitoring to help you get the most out of this monitoring strategy. These include:
- Setting proactive alerts
- Setting monitors for critical business transactions
- Testing from multiple locations
- Understanding the reports
- Using both synthetic and real user monitoring (RUM)
By the end of this article, you’ll have an in-depth knowledge of what synthetic monitoring has to offer, and how you can use it to improve your site’s performance.
What is a synthetics monitor? Synthetic monitors simulate several functions allowing you to test if all your web application’s pages, endpoints, transactions and page performance continuously, so when there’s a problem with any of them, you’ll know about the issue(s), and hopefully you can resolve them before they impact your users.
1. Set Alerts
Synthetic monitoring will actively track your web applications’ to ensure they’re working to an optimal level of performance. Tracking options include:
- Uptime monitoring
- Page speed monitoring
- Transaction monitoring
The SolarWinds® Pingdom® synthetic monitoring functions will simulate activity on your web applications and services, checking key components (web pages), APIs, DNS, network, etc.) of your web application to make sure they’re up and available, recording page load times, and testing to see if site transactions are all running smoothly.

Crucially, Pingdom will then send alerts if it detects an outage or other issue with how your web application is performing. Equally, you can set benchmarks for expected performance, and if your site’s functionality drops below these levels you will receive an alert. When Pingdom detects an outage, it will test it a second time from another probe to validate the alert, reducing false positives.
Pingdom enables you to customize your alerts, ensuring wherever you are and whatever you’re doing, the alerts will reach you. This is key if you want to keep disruption to your web applications to a minimum—the faster you can find out about a problem with your application the faster you can fix it.
Customization options include:
- Select how you receive alerts – Options include SMS, email, or push notifications to Android or iOS. You can also integrate your Pingdom account with a compatible app, such as Slack, VictorOps, OpsGenie, PagerDuty, and many more. Usefully, you can change the type of alert you receive depending on the severity of the incident.
- Select when you receive alerts – Pingdom allows you to decide how quickly you receive alerts after a problem occurs. You can then also opt to have alerts re-sent up to four times and receive a confirmation message once your site is back up and running.
- Set up alerts for the whole team – Notify up to 15 team members when an outage or issue occurs. Equally, you can select individuals to be recipients of incident specific alerts, ensuring the right people are contacted during any type of problem.
By customizing how, when, and who receives alerts, you ensure a fast response to any website issue. This will ultimately ensure your customers face minimal disruption, and loss of revenue is kept to a minimum.
Fast and Reliable Website Monitoring
Make sure you’re always the first to know when your site is unavailable or slow.2. Set Up Transaction Monitoring
Monitoring your uptime and page speed is traditionally what comes to mind when synthetic monitoring is mentioned. However, transaction monitoring is an extremely valuable arm of synthetic monitoring, enabling you to test every user interaction occuring on your website and ensuring they’re fully functional.
For example, if you run an eCommerce store, you can set up transactional monitoring to test your checkout flow. If an issue is detected at a particular point of the process, then an alert is sent, enabling you to act quickly to fix the problem. Without transactional monitoring, it would take longer for the problem to become apparent, and in the meantime your customers may have left your site to make purchases elsewhere.
With Pingdom synthetic transaction tools you can track any site interaction, whether simple or complex. These include:
- New user registrations
- User login
- Search
- Shopping cart checkout
- Form fields
- URL hijacking
Pingdom provides a built-in editor, so you can set up transaction monitoring without having to touch a line of code. Select from an extensive list of commands and elements to create virtually any site interaction flow.
Once set up, Pingdom will check your transactions up to every five minutes from servers around the globe. The simulated tests occur within a real Chrome browser, so JavaScript and other interactive functions perform as they would in a real-life situation, helping to produce accurate results. Alerts are then immediately sent if any issues are detected, so they can be fixed before they affect the experience of your users.
3. Test from Multiple Locations
Pingdom synthetic monitoring tools can test your website’s performance from a range of geographical locations situated across the world. These tests will give you a simulated but accurate representation of how your users on-site experience differs depending on their location.

If your target audience is based in a particular geographical location, then it’s vital you monitor page load times and website outages in the area. This ensures you’re kept aware of any performance-related issues and can act quickly when they arise, giving your most important customers the best experience.
Pingdom has over 100-plus servers globally, allowing you to test your site from multiple locations. You can choose to monitor your site from one of five global regions, including:
- North America
- South America
- Europe
- Asia
- Australia
Once selected, up to 10 probe servers from varied locations within your region will actively test and monitor your website for speed, uptime, transaction performance, and more, and then alert you to any problems.
By testing your website from an array of locations, you’ll gain insight into localized speed or performance issues, and location specific CDN outages. These insights can then be used to further optimize your site for your highest earning regions.
4. Understand the Reports
Cloud performance monitoring produces large amounts of data, and if you want to get the most out of your monitoring tools then you need to learn not only how to interpret the reports, but how to then implement changes based on the findings.
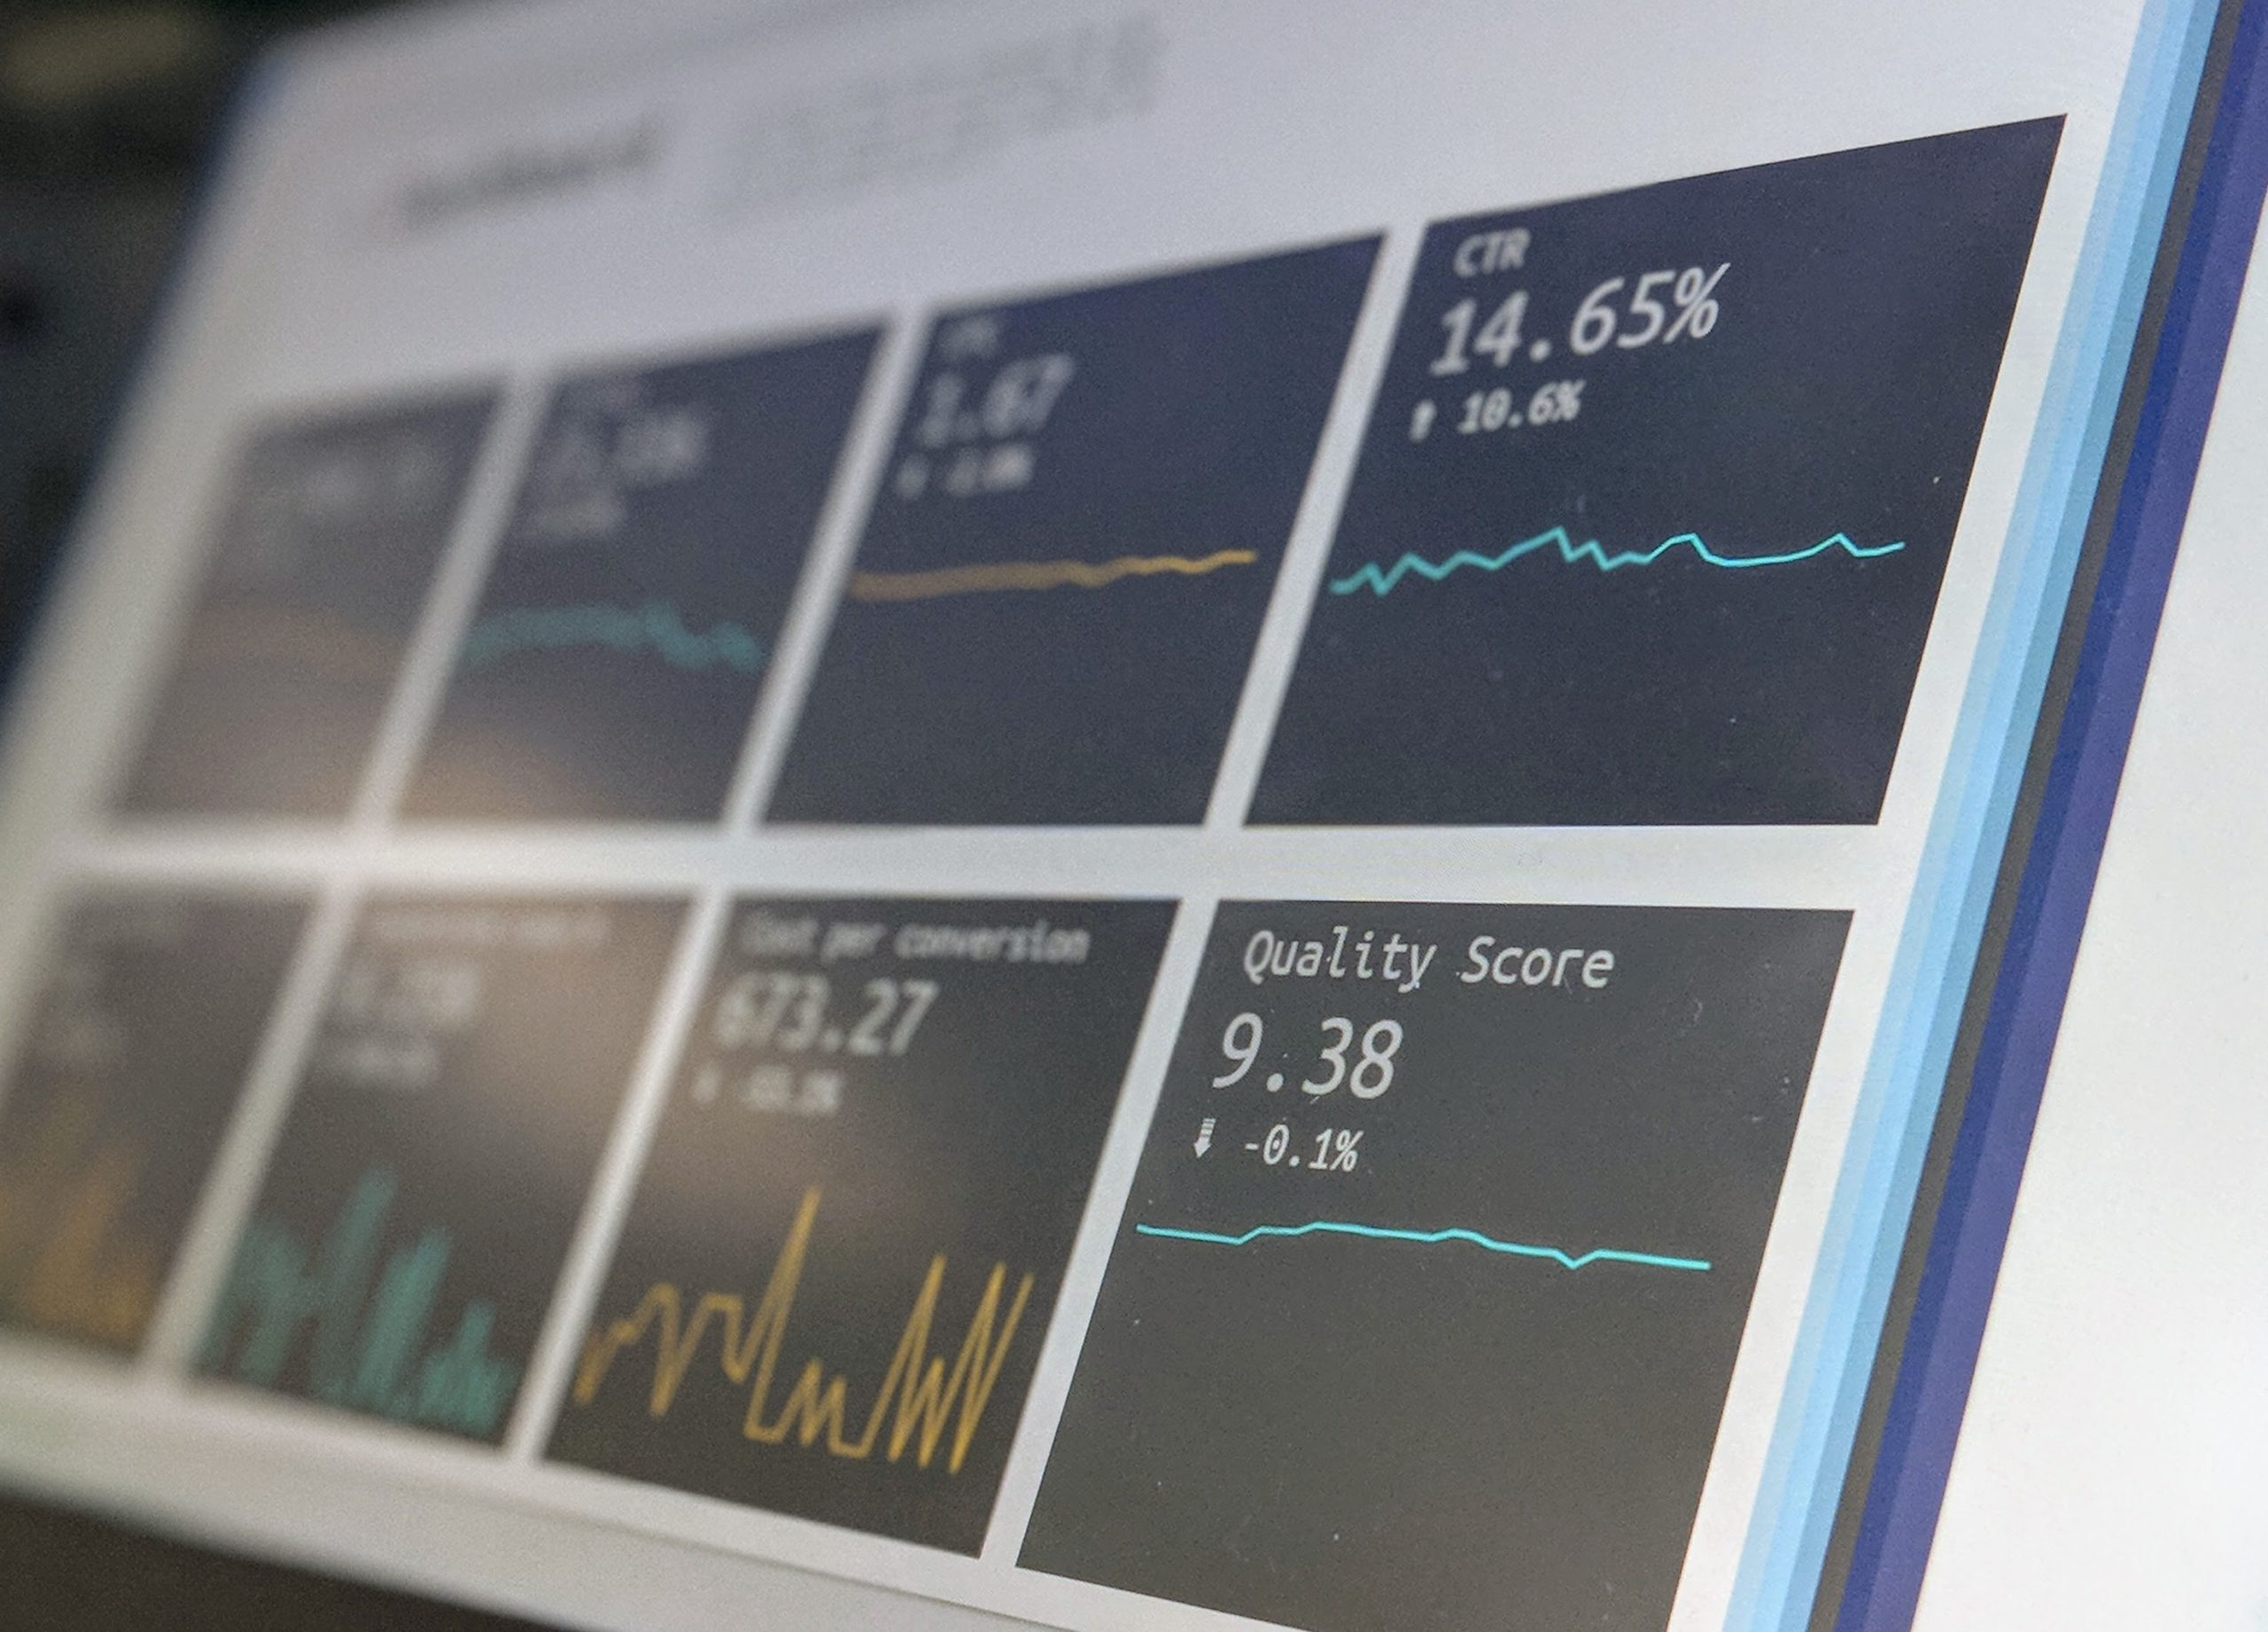
Luckily, Pingdom uses clear visual graphs and charts to help you understand how your website is performing, and what needs to be improved.

- Uptime reports – Pingdom reports on uptime, downtime, and response time, so you can see how your website has performed over a set period of time. Importantly, when an issue occurs, Pingdom runs additional tests, performing a root cause analysis, to help identify what has gone wrong. You can also dig deeper into any problems, running a traceroute to identify the server’s output and response codes. This information will help you not only solve the problem but implement steps to prevent it reoccurring if possible.
- Transaction reports – View average execution times for each transaction over a set period of time, as well as any outages detected. Helpfully, the user-friendly Pingdom dashboard includes data visualizations which highlight any abnormalities needing to be addressed.
- Page speed reports – Pingdom doesn’t just report on basic page speed. Advanced tests analyze the loading speed of every single asset on each page of your site, including HTML, CSS, JavaScript, and more. From this data, you’ll have a clear understanding of which elements need optimizing to reduce page size, and improve load times.
5. Use Both Synthetic and Real User Monitoring
Synthetic monitoring and real user monitoring (RUM) are both invaluable tools for monitoring the health and performance of your web applications’ and produce the best results when used alongside each other. Whereas synthetic monitoring is effective for proactive, near real-time identification of problems, RUM provides insights into the actual user experience and performance with your web applications.
RUM tracks actual users on your site, giving you real data on how people interact with your web application, and the experience they receive. You can view each journey a user makes on your site and analyze the loading times they experience on each page.
Importantly, with RUM, you can filter the data into specific groups, enabling you to analyze how load times compare across countries, devices, and browsers. You can also view data over time to see if changes you have implemented have improved your site’s performance.
Real user monitoring should be used as the foundation of your monitoring strategy, giving you a long term understanding of your site’s performance. Once issues have been highlighted through RUM, you can then use synthetic testing to drill down and get to the bottom of why and where specific problems are occurring .
Final Thoughts on Synthetic Monitoring
Evidently, synthetic monitoring has lots to offer, and by following these top tips on best practice, you can access valuable information on loading times, user experience, and the overall performance of your website. You can then use this knowledge to make data driven decisions on future site improvements.
Ready to give SolarWinds Pingdom a try. Sign up for our 14-day free trial.
Using synthetic monitors to continuously test your web application’s health and performance is essential if your applications are critical to your business. Learn five best practices for implementing synthetic monitoring.
Visibility into the health and performance of your web applications is required for your IT operations, and anyone responsible for keeping your business-critical web applications up and running. Get five best practices for synthetic monitoring to get real-time visibility.

These days, systems and applications evolve at a rapid pace. This makes analyzi [...]

Last updated: February 29, 2024 Average size of a webpage matters because it [...]

Last updated: February 28, 2024 Websites have become larger and more complex [...]

Last updated: February 28, 2024 Sometimes when you try to visit a web page, [...]

Last updated: February 28, 2024 Page load time and response time are key met [...]

Providing a Seamless Digital Experience Customer engagement with your company’ [...]

By Leigh Brown In February, we wrote about how major live sporting events in Ma [...]

By Patrick Hubbard, SolarWinds Head Geek When done well, application performanc [...]

By Patrick Hubbard, SolarWinds Head Geek The Web Performance Monitoring Do-Over [...]
As anyone with some experience running web applications will tell you, page spee [...]

Let’s look back at the highs and lows from 2010 to 2019. From the viral Double [...]

Poor digital experience can kill your business. 57% of shoppers have left a slow [...]

Seasonality in E-Commerce Comes in Many Forms Many e-commerce sites deal with se [...]

Being notified by a customer, friend, or someone outside your office that a webs [...]

APIs make the world a bit smarter. They help us improve and extend what others h [...]
Last updated: February 28, 2024 Sometimes when you try to visit a web page, [...]

At the scale that Facebook operates, several traditional approaches to serving w [...]
Providing a Seamless Digital Experience Customer engagement with your company’ [...]
By Leigh Brown In February, we wrote about how major live sporting events in Ma [...]
Let’s look back at the highs and lows from 2010 to 2019. From the viral Double [...]

Nowadays we are used to having hundreds of gigabytes of storage capacity in our [...]

A while back we delivered a report on social media demographics as they stood in [...]

By now you all know that we just love measuring and analyzing the performance o [...]
We love to measure and analyze the web performance of sites here on the Royal Pi [...]

In 2015 the interest for web performance and availability soared to new heights. [...]