


Once you have deployed your website on the internet, you will want to make sure it works well and acts as you intended. You may also want to look at other, similar websites, to see how they have solved the challenges you yourself face with your own website.
This is where the Full Page Test in Pingdom Tools comes in. It allows you to view information about all objects on a web page such as images, scripts, CSS files, etc. You can view file sizes, detailed load times, file types, website structure, and much more.
This article will guide you through some of the uses of the Full Page Test.
Getting started
Before you do anything else, open up a new window with the Full Page Test, type in a URL and press “Test”. This will parse the web page and load all the objects.
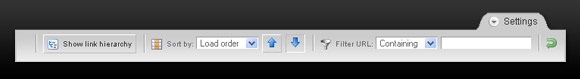
That’s only the starting point, though. Now you can filter the results using the toolbar at the top of the page to find out a lot more.
View the web page structure

Click on Show link hierarchy. This puts all objects in a tree structure so you can see which images are referenced from external CSS files, if there are any redirects, and so on.
Where are the bottlenecks?
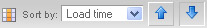
To find out why a website loads slowly, a good start is find out which parts of the page are the slowest to load.
Simply select Sort by load time. By clicking on the up and down arrows on the toolbar you can show either the slowest- or the fastest-loading objects at the top.
It also pays off looking closer at the load bars. Which part takes the most time? Contacting the server (yellow), starting the loading (green) or loading the actual linked file (blue)?
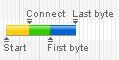
(Tip: Hovering your mouse pointer over a bar will show the total load time in digits.)
Optimize a page for size
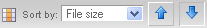
Nobody likes a bloated website, especially if they are sitting behind a slow internet connection. If you want your site to be responsive for dial-up users you should try to minimize the size of your web pages. Finding the largest objects (files) is a good start. This will often be images, and sometimes scripts. To do this, simply select Sort by file size.
Show only external links

It can be useful to see if there are any external objects being referenced by a website. They are already visible in the list, but in the midst of perhaps several hundred loaded objects they can be hard to single out.
Fortunately this is easy to fix. Set Filter URL to Excluding and type in the website domain name (for example “pingdom.com”). The list of objects will be updated as you type. Now you only see objects that don’t contain the website’s own domain (in other words, external objects, for example to statistics packages such as Google Analytics or images on Flickr).
Show only a certain file type

Set Filter URL to Containing and type in the file extension (for example “.jpg” or “.js”).
Show only ads

Set Filter URL to Containing and type in “ads” or whatever the string in the banner/advertising URL is on that website. Filtering for “google” will show you Google ads (and possibly other links to Google, of course), and so on.
Endless possibilities
The filtering options are really powerful. Note that all the filters can be combined. This means that, even excluding the Filter URL feature, the toolbar gives you 20 different ways to view the objects of a website. If you include the Filter URL feature, there are no limits whatsoever. The tips in this blog post were just a few examples to get you started.
What are you waiting for? Go try out your new Pingdom Tools skills right now!


