


Whenever a website goes down it loses exposure. Downtime is always bad, but for some a little bit of lost exposure now and then doesn’t matter all that much. For others it can be a very expensive affair, for example websites that get their income from advertising.
The effect of lost exposure is relative to the amount of visitors and page views you normally have. The more visitors and page views you have, the more negative the effect.
Lost eyeballs
Though visitor numbers can vary greatly over the 24 hours of the day, for the sake of simplicity (we like simplicity…) we can calculate the average amount of unique visitors per hour in the following way: Unique monthly visitors / 30 (or 31, or 28 depending on the month) / 24.
If you take the number of hours of downtime you’ve had in a month and multiply it by this average number of users per hour, you’ll get an estimate of how many unique visits (eyeballs) you have missed out on. 100 users per hour and 10 hours of downtime will have lost you approximately 1000 unique visits that month. This of course depends a lot on the user behavior of your regular visitors, so see it as a rough estimation. Lost visitor numbers can be very interesting for example to e-stores.
Lost page views
If you are more concerned with page views than actual eyeballs, then you of course should calculate the average number of page views per hour in the same fashion as you did with the average number of visitors.
It’s interesting to note that a website with many page views per visit will be much more affected by downtime, exposure wise.
An example of lost exposure for two different sites
Take two sites, both with 10,000 monthly visitors, but with different user behavior. Because the sites are used differently, they have a very different number of page views per visit.
Site 1: 5 page views per visit (for example a regular blog)
Site 2: 50 page views per visit (for example a community site)
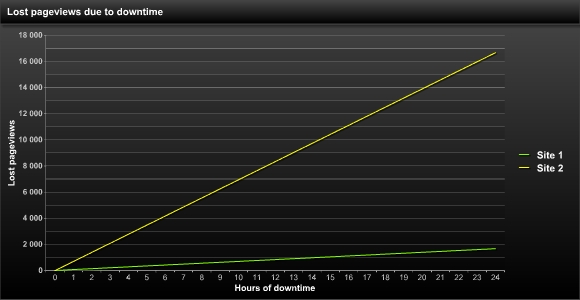
As you can see, even though they have the same amount of visits, the site with more page views per visit loses a lot more exposure (in this case 10 times more).
If you have a website that generates income from ad exposure, you now have a good model to calculate how much money you have potentially lost.
Loss of income
Estimating how much your income is affected by downtime is easy. You already have all the data you need. You know how many unique visitors you have per month, and you know how much income the site generates per month. Just divide the income by the number of unique visitors and you get an estimation of how much income every unique visitor generates (interesting for example to e-stores, as mentioned above). If you are focused on ad income, you might want to use an average based on page views instead of visitors, but the end result will be the same.
Multiply by the downtime, and you get your lost income.
Of course, if you have no interest in finding out how many eyeballs or page views you lost, you might as well go directly to the lost income by calculating your average income per hour and multiply that with your downtime.
There is room for a more complex model
A more complex, but also more accurate, model would be if you could measure the average visitor traffic for each of the 24 hours of the day for all 7 days of the week. Night time may have less visitors (but not necessarily, because night at your place is daytime somewhere else). Then you could take the actual time interval of the downtime and calculate lost income relative to that. But by then the calculations become so detailed that you would need some kind of software (or have a lot of free time on your hands).
A grain of salt may come in handy
Keep in mind that estimates should always be taken with a grain of salt. Website visitor behavior is complex and diverse, so no one model will ever suit all kinds of websites. The point of this article was not to give definite answers, but to show that estimating income and exposure loss due to downtime doesn’t have to be difficult. And always remember that everything is relative. The effect of an hour of downtime for this blog isn’t even on the same planet as the effect on for example YouTube or Myspace (doh).


