Synthetic Monitoring

Simulate visitor interaction with your site to monitor the end user experience.

View Product Info

FEATURES

Simulate visitor interaction

Identify bottlenecks and speed up your website.

Learn More

Real User Monitoring

Enhance your site performance with data from actual site visitors

View Product Info

FEATURES

Real user insights in real time

Know how your site or web app is performing with real user insights

Learn More

Infrastructure Monitoring Powered by SolarWinds AppOptics

Instant visibility into servers, virtual hosts, and containerized environments

View Infrastructure Monitoring Info
Comprehensive set of turnkey infrastructure integrations

Including dozens of AWS and Azure services, container orchestrations like Docker and Kubernetes, and more 

Learn More

Application Performance Monitoring Powered by SolarWinds AppOptics

Comprehensive, full-stack visibility, and troubleshooting

View Application Performance Monitoring Info
Complete visibility into application issues

Pinpoint the root cause down to a poor-performing line of code

Learn More

Log Management and Analytics Powered by SolarWinds Loggly

Integrated, cost-effective, hosted, and scalable full-stack, multi-source log management

 View Log Management and Analytics Info
Collect, search, and analyze log data

Quickly jump into the relevant logs to accelerate troubleshooting

Learn More

Pingdom’s Live Map Shows You The State Of The Internet As It Happens

When we talk about website outages, we usually think of when something really big happens, like when Facebook goes down or when an error in code took AWS Eastern US servers offline for hours. In reality, website incidents and outages are happening all the time. In fact, we registered over 225 outages in the time it took to write these three sentences.

Having celebrated its 4th birthday this year, we decided our live map needed a makeover. We’ve used the opportunity to share all of the additional data we are able to collect today, like what browsers Internet users are using and from what device they are browsing from. Check it out!

Real user data is more important than ever

Nowadays, making sure your website is available and accessible is a given. But making sure that your visitors have the best possible experience is equally important: websites perform and appear differently on different browsers. Having a website look the same across browsers and devices has been an ongoing issue for designers all over the world.

More often than not, delivering a high-quality site experience means identifying what device and browser your visitors use and ensuring that your website appears and functions as intended.

Knowing what browsers and devices your visitors use is crucial

It goes without saying that checking your website in multiple browsers is crucial to delivering the best possible site experience to your visitors. Have you ever noticed that websites can look different depending on if you load it in Chrome or Edge? Having a website totally optimized for a Safari browser means little if the majority of your visitors browse from Chrome. Sadly, you have no control over which browser your visitor chooses to use but you can monitor which browsers your most vital visitors use and optimize your site accordingly.

The same applies for devices: the best sites are optimized for cross-device browsing, whether it be from a laptop, tablet or mobile phone. By understanding who your visitors are and how they visit your site, you can increase on-site engagement and conversions as well as lower abandonment rates.

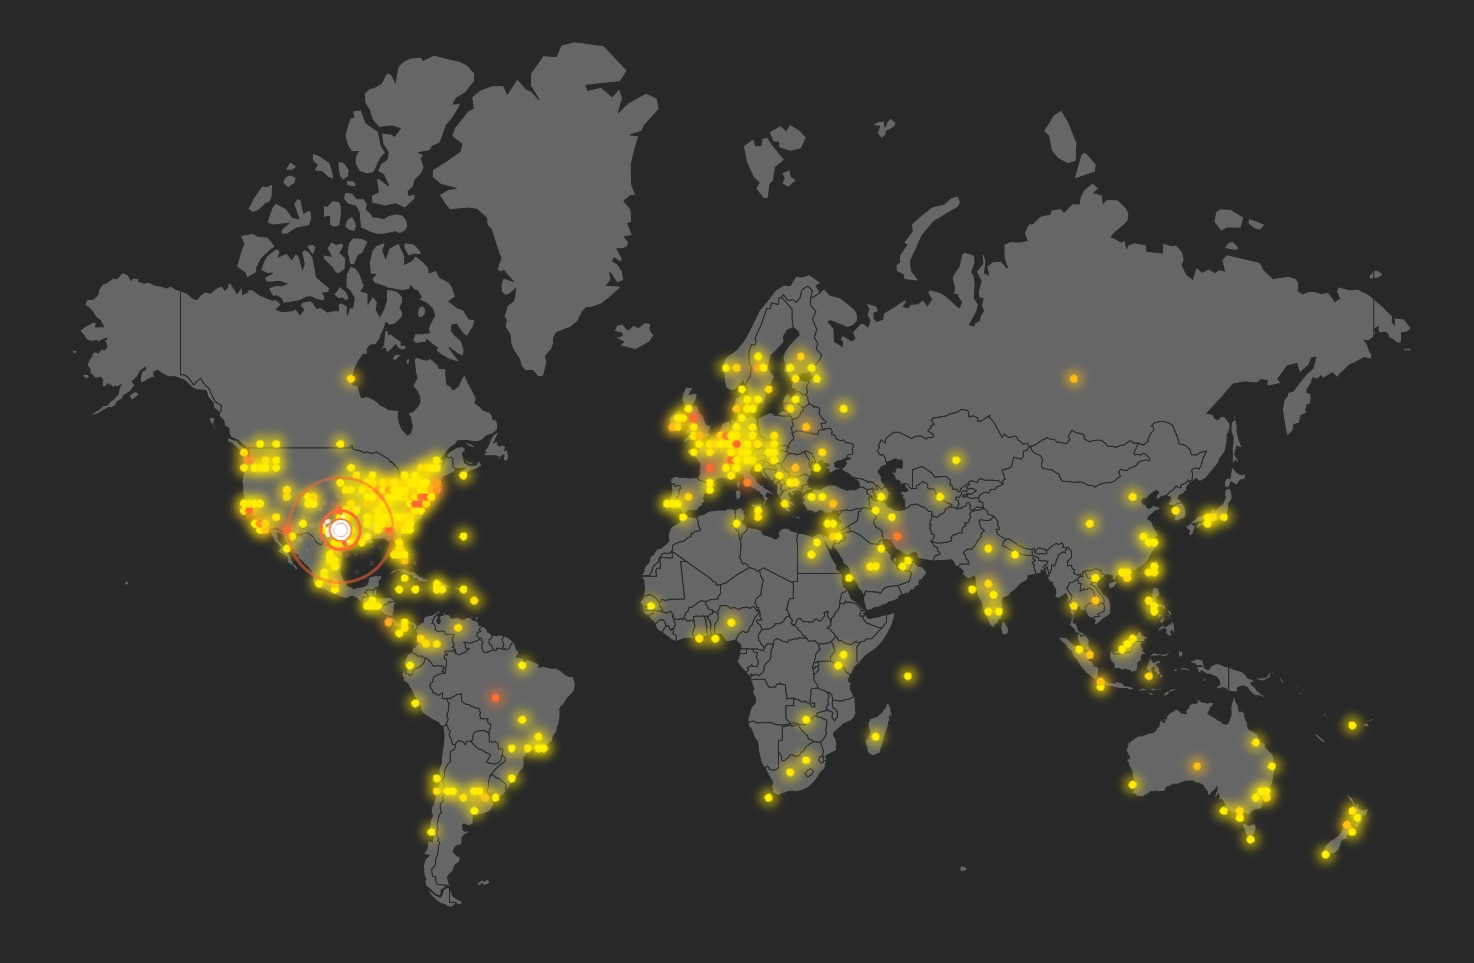
Our updated live map allows you to see the State of the Internet today, from how many outages we’ve detected in the last hour, most common error messages to what devices and browsers Internet users are using.

Our mission is to make the Internet faster and more reliable and with this map, we hope to bring to attention just how easily your websites, servers and applications can go down.

CHECK OUT OUR NEW LIVE MAP

Introduction to Observability

These days, systems and applications evolve at a rapid pace. This makes analyzi [...]

Webpages Are Getting Larger Every Year, and Here’s Why it Matters

Last updated: February 29, 2024 Average size of a webpage matters because it [...]

A Beginner’s Guide to Using CDNs

Last updated: February 28, 2024 Websites have become larger and more complex [...]

The Five Most Common HTTP Errors According to Google

Last updated: February 28, 2024 Sometimes when you try to visit a web page, [...]

Page Load Time vs. Response Time – What Is the Difference?

Last updated: February 28, 2024 Page load time and response time are key met [...]

Monitor your website’s uptime and performance

With Pingdom's website monitoring you are always the first to know when your site is in trouble, and as a result you are making the Internet faster and more reliable. Nice, huh?

START YOUR FREE 30-DAY TRIAL

MONITOR YOUR WEB APPLICATION PERFORMANCE

Gain availability and performance insights with Pingdom – a comprehensive web application performance and digital experience monitoring tool.

START YOUR FREE 30-DAY TRIAL
Start monitoring for free