This report presents an analysis of 100 top blogs, picked from the Technorati top 100 list. For each of these blogs, the front page (homepage) has been analyzed to see how large its download size is and what contributes the most to this size.
We have chosen to not present the blogs individually in this report, but have instead focused on them as a group to get more general data.
Total blog front page size
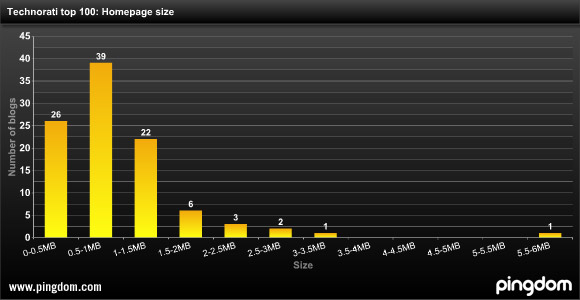
The size difference between the different blog front pages was very large. One front page was close to 6 MB in size, though it is an extreme case and should not be considered representative. Most blog front pages, 93%, were below 2 MB in size.
- The average total size of the front page was 934 KB.
- 35% had a front page larger than 1 MB.
- 26% had a front page smaller than 500 KB.
- 39% (the largest segment) had a front page between 500 KB and 1 MB.
Images and scripts the largest contributors to size
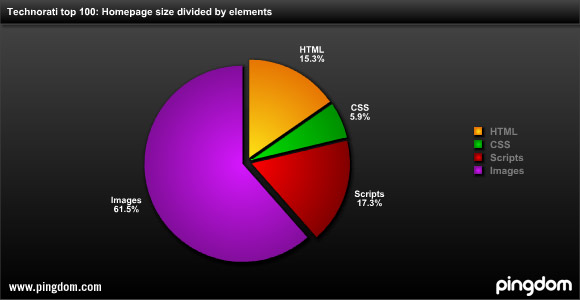
When averaging all the 100 blogs included in the survey, it was clear that the single largest contributor to the size of the front page was images, which in itself should not come as a surprise considering that today’s blogs often are very visual and contain many images.
- Images: 61.3%
- Scripts: 17.2%
- HTML: 15.3%
- CSS: 5.9%
Number of images per page
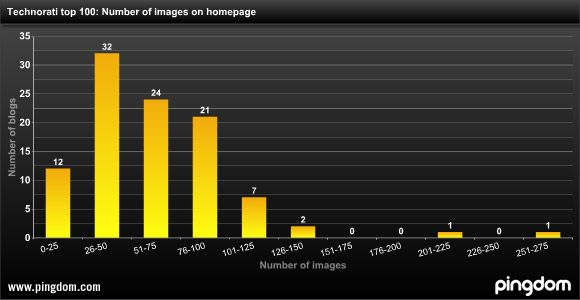
On average, there were 63 images included on the front page, though the number varied greatly. Some had less than 10 images, while others had more than 100. You can see the distribution in the diagram below.
In addition to images in the posts themselves, images are also common in the design of the layout of the blog, which can explain the large number found in some blogs. Both images included in the HTML and the CSS are included in this count.
Number of scripts per page
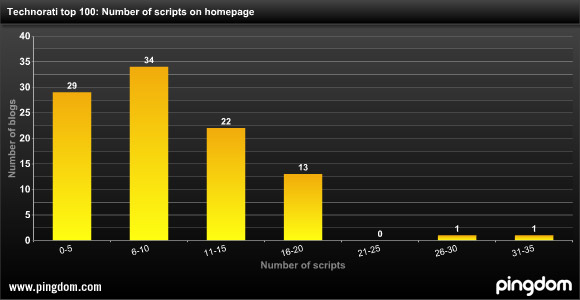
On average, there were 9 script files included on the front page, and here too the number was very varied between the different blogs. The page with the most scripts had as many as 35 script files included.
Scripts are often included from external sources, for example visitor statistics scripts such as Google Analytics and Sitemeter. Other examples are WordPress plugins, which often add their own Javascript files to the blog.
Blog readers without broadband left stranded
As this survey has shown, three out of four blogs have front pages larger than 500 KB, and more than one third have a front page larger than 1 MB.
With an ideal, perfect connection, this is how long it takes to download 1 MB (1048576 byte) of data:
- 56 kbit/s modem: 2 minutes and 30 seconds
- 256 kbit/s (minimum limit for broadband): 33 seconds
- 384 kbit/s (3G “low speed”): 22 seconds
- 1 mbit/s (low-end broadband): 8.4 seconds
- 10 mbit/s: 0.84 seconds
Note, however, that this assumes that the bandwidth is utilized to 100%, which normally won’t happen. The above numbers just show you the theoretical upper limit.
In short, blog readers with slower connections will have problems loading the front page of many of today’s blogs, at least with images enabled.
Size and speed optimization of blogs
Since images constitute almost two thirds of the size of the entire page on average, it would seem logical to start the optimization there. This can be done in two ways (which are not mutually exclusive):
- Optimize the size of the images. Depending on its content, an image size can be optimized by choosing an appropriate format, compression level, color depth, and other relevant settings.
- Use fewer images (many blogs have a large number of small image elements). This will also have the positive side effect of fewer requests being made to the web server which is also beneficial for performance. One way of having fewer images is the use of so-called sprites, where several images are stored in one.
Since scripts came in second, size wise, here are a few tips that apply to reducing the impact of scripts on the load time:
- It can be a good idea to see if it is possible to reduce the number of scripts used on a blog. Are all of them really necessary? Are there for example scripts present from WordPress plugins that you are not using anymore?
- Since reducing the number of requests to the web server is a good way to enhance performance, it is often a good idea to merge all your scripts (or at least most of them) into one file, making it one single download.
- Another factor to consider is that by including external scripts, a blog’s load time can be affected by loading issues with that external script (which is outside the blog owner’s control).
These are just a few advice regarding these specific areas. Website optimization is a huge subject and going into detail here would be outside the scope of this report.
Conclusion
There will of course be some size variations depending on the current content presented on the blogs, but the overall, average data is not bound to change much and is highly relevant, especially considering the large sample base.
Since many blogs try to attract a large number of readers, they may be doing themselves a disservice if they let their blog size get too big, which will result in a slow-loading blog. Browser-side caching will help things a bit for frequent readers, but any new or casual visitor will have to load the page in its entirety and some may give up before it is finished or at least get frustrated. (And no one wants frustrated readers.)
Even broadband users would benefit from smaller page sizes with fewer objects on them. This would speed up the responsiveness of the website for them as well. Ultimately it would also be beneficial for the blog owner since it would put less stress on his server(s) and demand less bandwidth.
We suspect that not all blog owners are really aware of how large their blog pages actually get, so we hope that this report will prove helpful in raising discussion around this subject. Some blogs are bound to be large, especially if the content relies heavily on images, but many others could most likely significantly reduce their download size (and download speed) with the few simple measures we mentioned above.
About the test
The data was collected with the Full Page Test in Pingdom Tools, which is a Web-based tool provided freely by Pingdom. It will load and analyze all elements of a web page and present the data in a way that can be examined and filtered with a simple interface.
The tests that provided the basis for this report were performed on October 30, 2008.


