


Web users now have such high expectations for website performance that a few minutes of downtime or a half-second delay in page loading can mean the difference between a sale and lost opportunity. Because so many customer-facing interactions are now conducted through the web, any downtime or subpar performance can lead to brand damage, degraded employee morale, and lost sales.
Putting a plan in place to protect your sales opportunities and customer experience starts with establishing your Service Level Objectives (SLO). These objectives set expectations for what level of availability your operations team should target. They often include indicators for both uptime and performance. For service providers, you may additionally have a Service Level Agreement (SLA), which is a contract with your clients that specifies what happens when you don’t meet the required objectives, the terms usually are negotiated with the contract. For a good overview of SLOs and SLAs, see this introductory video from the Google Cloud team.
An SLO is a critical part of web hosting, and should be designed and continually monitored to serve as a map to meet your web needs and those of your customers. Understanding how your website performs relative to your SLO and defined benchmarks can help ensure that your users have the best experience and by extension can help support the overall growth of the business. Organizations need to use the right tools to continually monitor and model performance, to help ensure their providers are living up to these objectives. We’ll take a look at how tools like SolarWinds® Pingdom® can help you monitor key indicators, including your site’s availability, page speed, and real user performance.
Tracking site availability
While website reliability is an essential part of producing and protecting business opportunity, many organizations may not realize how large an impact even the slightest downtime can have. Most web hosting providers will include expected uptime in their SLO. While 99% uptime may seem satisfactory on the surface, it means the site could be down for up to 3.5 days per year. That’s enough to produce a significant loss in sales, and it’s even worse if that happens during peak times. A retailer whose website goes down for a couple days in December could experience devastating losses, and a manufacturer whose product manuals are inaccessible for a week would spark the ire of customers.
While it may be better to aim for “five nines” or 99.999% uptime (about five minutes of downtime per year), this often comes at a higher price. This can be felt in the amount of testing done before releases, slower and safer release schedules, and redundancy in infrastructure for high availability services. Organizations must plan carefully to determine the appropriate level of reliability that needs to be in their SLO.
An uptime monitoring tool like Pingdom can continually test the availability of the website and applications from a network of servers across the globe. It can also send notifications when it detects an incident and perform a root cause analysis to identify the issue and how to repair it.

Measuring page speed and load times
In 2018, web users have little tolerance for slow-loading pages. The probability of a bounce increases with load times, and in some cases a second can be the difference between a closed transaction and lost sales.
Google’s John Miller said in 2016 that he aims for less than two to three seconds in page load time. Recent research from Google noted that 53% of people will leave a mobile web page it if takes longer than three seconds to load.
Millions of speed tests performed with our tools show that the average load time for a web page is 3.21 seconds. It’s important to know where you stand and how long your customers will wait before getting frustrated. In some industries, such as banking and retail, page speed is essential. But in others, such as travel and technology, a slower page may be an acceptable tradeoff to deliver rich content.
An appropriate response time and page load time should be written into the SLO. The response time is the time it takes to reach the URL, receive headers, and load the HTML off the site. The page load time is how long a specific page takes to load in its entirety, including all images, scripts, CSS, and third-party resources.
There are often several ways to increase website speed, including compressing images and text, using GZIP compression, and adjusting JavaScript and stylesheets. But it all starts with having the right tools.
An effective page speed monitoring tool can automatically test page loading times every half hour to help developers identify performance bottlenecks and model the impact of changes. It can itemize every element on the page to determine what may be slowing it down and identify action items for improvements. This allows your team to schedule piecemeal adjustments to reach your target speeds.

Obtaining real user performance
While uptime and page speed are important factors in an SLA, they don’t give the entire picture of how site performance can impact sales opportunities. They are often measured from one or more datacenter locations, which may have better than typical network or rendering speeds. Given the diversity of network speeds and browser technologies, organizations need a clear understanding of how real users experience the website.
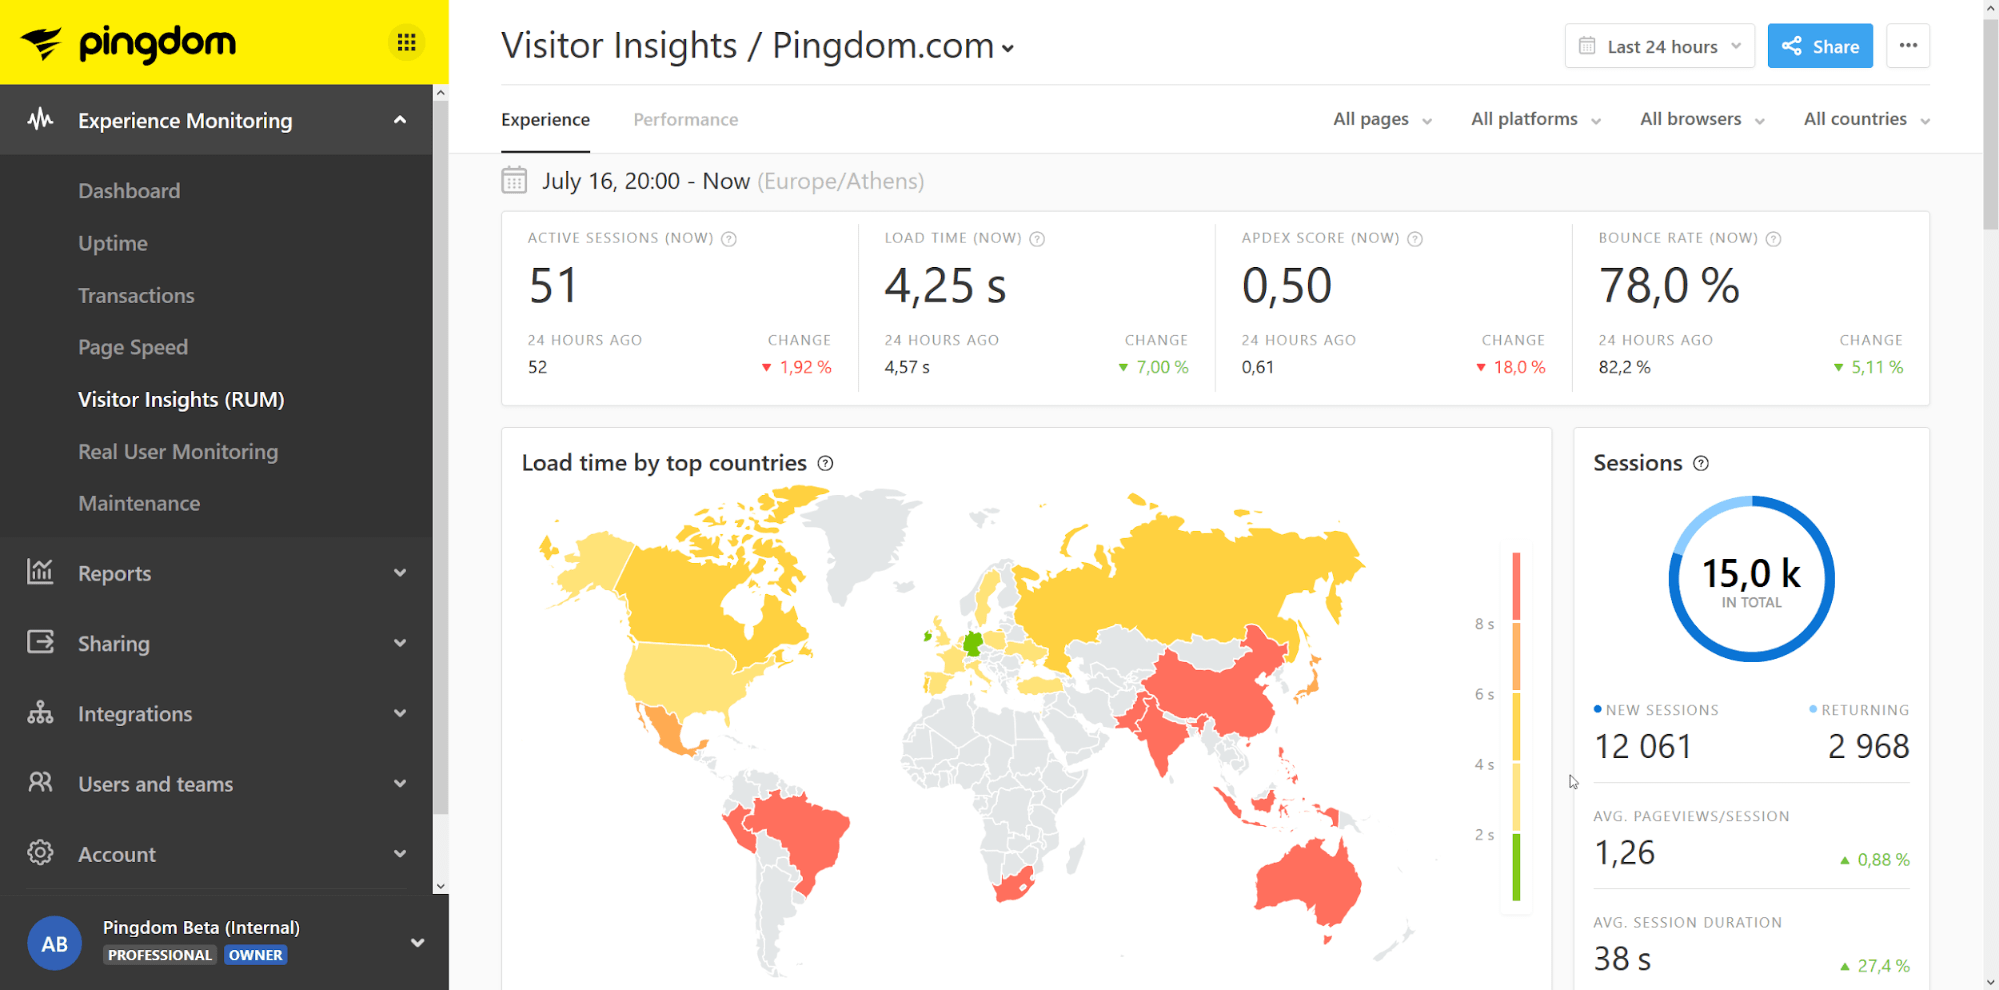
Web developers need insight into how their visitor data correlates to browsers, platforms, and geography. A user performance monitoring tool can help them visualize how their most important customers are accessing and using the site and how they make informed decisions in the process. Measuring and obtaining visitor insights can help identify what is influencing bounce rates by flagging page bottlenecks and the issues that are causing them.

Comprehending user performance is crucial in understanding how they transact with the site. An effective transaction monitoring tool can tell more than just whether customers make a purchase. It can simulate each step of a multistep transaction and measure the availability and performance for each step, enabling developers to test changes before they make them live.
Monitoring website performance can be an essential part of producing and protecting sales for a business. An effective monitoring solution can help ensure you’re establishing the right expectations in your SLOs and SLAs. It will help you make informed decisions with extensive data from every part of your website.
Pingdom helps you leave no stone unturned with a complete website monitoring platform that offers easy, automated oversight over your most important performance metrics. It monitors uptime, page speed, visitor insights, transactions, servers, and web applications with alerting to help ensure your developers are the first to know when an issue arises. Sign up for a free trial today.


