


Forums are a great resource, and there seems to exist at least one for every subject imaginable (yes, really). This being the web, there are of course bound to be a lot of forums that focus on webmasters and web hosting.
It isn’t always easy to keep a forum running smoothly. Forum software is notoriously resource heavy, and as forums grow, they can take a significant toll on the server they are hosted on. Since few people are as concerned with uptime and website performance as webmasters, we figured we would monitor the forums where the webmasters themselves hang out.
Why care about uptime, you ask? The short answer is: If a website is down it is invisible, both to visitors and search engines.
Ok, enough talking. Here they are, 20 of the top webmaster and hosting forums and their uptime, response time, and as a bonus, an link to an uptime report page that is being continuously updated.
| Forum name | Avg response time (ms) | Downtime (minutes) | Uptime % | Uptime report page |
|---|---|---|---|---|
| Ozzu Webmaster Forum | 686 | 0 | 100% | Report |
| WebmasterWorld | 733 | 0 | 100% | Report |
| Web Host Directory Forums | 829 | 0 | 100% | Report |
| v7 Network Webmaster Forum | 938 | 0 | 100% | Report |
| Web Hosting Talk | 955 | 0 | 100% | Report |
| Reseller Board | 1115 | 0 | 100% | Report |
| TopHosts Web Hosting Forums | 1464 | 0 | 100% | Report |
| Web Hosting Chat | 903 | 10 | 99.93% | Report |
| Geek/Talk Webmaster Forum | 860 | 20 | 99.91% | Report |
| iWebtool Talk | 1652 | 50 | 99.77% | Report |
| SitePoint Forums | 3301 | 55 | 99.75% | Report |
| Webmaster-Forum.net | 841 | 59 | 99.72% | Report |
| The Webmaster Forums | 632 | 60 | 99.72% | Report |
| Hot Web Hosting Talk | 997 | 69 | 99.68% | Report |
| Webmaster-Talk | 1318 | 85 | 99.61% | Report |
| OutFront Webmaster Forum | 775 | 95 | 99.56% | Report |
| Web Host Chat | 1036 | 120 | 99.45% | Report |
| Web Hosting Forum | 2604 | 174 | 99.19% | Report |
| HostingDiscussion | 1777 | 285 | 98.68% | Report |
| Digital Point Forums | 3560 | 300 | 98.34% | Report |
The table is sorted by uptime. Entries with the same uptime were sorted by response time.
The response times we are showing here include the load time of the HTML page (but no images or other resources), so perhaps we should have called it load time instead of response time. On the other hand, loading the HTML is only a small part of the page, so that would also have been a misnomer. Whatever you call it, it doesn’t tell the whole picture of how fast the entire site loads, BUT it does gives you a general idea of how responsive the site and the server is.
A note on response time
The response time numbers shown here are average values over many days (in this case just over 15 days). What that doesn’t show you is the great variation that can be seen over the course of an entire day, or over the course of a week or a month. There are also bound to be occasional spikes depending on usage (and possibly other factors, for example backups). Here is a good example, taken from our monitoring of Web Host Chat:
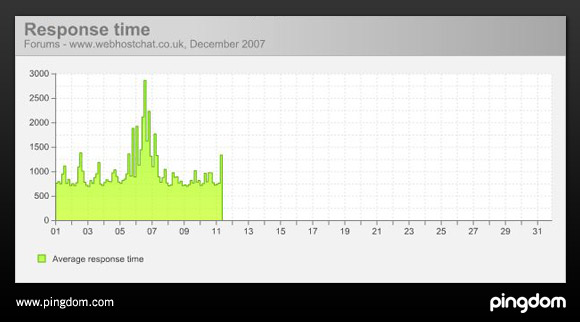
Again, note that this includes the loading of the HTML page.
Check out your favorite forum
As we stated earlier, these forums are a great resource, and we set up this monitoring because we were curious to see how they are performing. Pingdom is an uptime monitoring service, so we are always curious about these kinds of things.
We only have a few weeks of data so far, but we will let the server uptime monitoring continue, at least for a while, and see what happens. The public report pages will be up and running, so you can easily follow the uptime of your favorite forum(s). The pages are updated every 5 minutes.


