


 How much a single website is offline can vary a great deal from month to month. Some months, everything can be flawless, not a minute of downtime, while other months, perhaps thanks to one or more network outages or server problems, a website can be unavailable for hours.
Therefore it would be interesting to see how much, on average, websites are down every month, and what trends there are, which is something that we will look at here.
If you monitor the uptime of a large enough set of websites it is possible to estimate the average downtime of websites in general. We have used monitoring data from more than 2,000 websites to calculate the numbers in this article.
Here is a six-month overview of the average website downtime per month (in minutes), starting with March and ending with August:
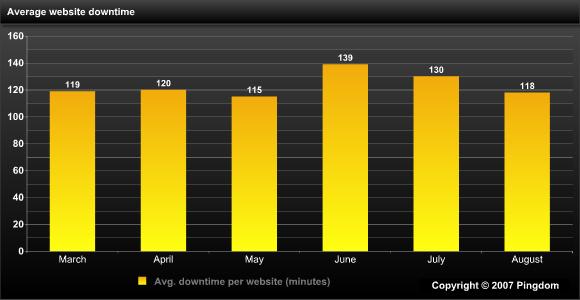
As can be clearly seen in the diagram, there is a sharp increase in the average website downtime in June compared to the three previous months (March through April). The average number for July is also higher than the norm. In August the level is back to more or less the same as it was in March through May.
If you count the “average of the average” for the website downtime over these six months, you end up with two hours and three minutes of website downtime per month. That would make June stand 13% above average, and July almost 6% above average.
Possible causes for the general increase in website downtime during these two months could be a combination of factors. Vacations and fewer available staff could lead to a slower response time when outages occur. Key personnel being on vacation could have a negative effect on solving issues rapidly, which would also lead to longer and possibly more outages.
All in all, these numbers seem to indicate that there is an increase in website downtime during the summer, at least for June and July. It would be interesting to compare these numbers with actual vacation statistics from around the world to see if they match.
Update:
Rich Miller at Data Center Knowledge had an interesting theory in response to this article:
Another possible cause might be rolling brownouts from local utilities as consumer power usage rises in the summer months, especially since so many leading web sites are hosted in California. I’d be surprised if June were the statistical peak season for utility brownouts, however. But at least someone thinks brownouts are closely tied to uptime. If you Google “rolling brownouts frequency“, three of the top four results are companies selling UPS equipment.
About the survey
Data source: The average website downtime is calculated from a set of more than 2,000 websites monitored by Pingdom GIGRIB.
Read more: Downtime report for March. Downtime report for April. Downtime report for June. The March report has more details about how the statistics are calculated.


